Graph Technologies

Advance your digital transformation initiatives with the power of graphs.

Pioneers in graph technology

Tom Sawyer Software was the first pure graph technology company. We understood early on how the power of graph could be applied to solve business challenges.

Our graph technology has been honed over decades and vetted by industry leaders. When you work with us, you know you'll receive best in class software and support from a graph technology veteran.
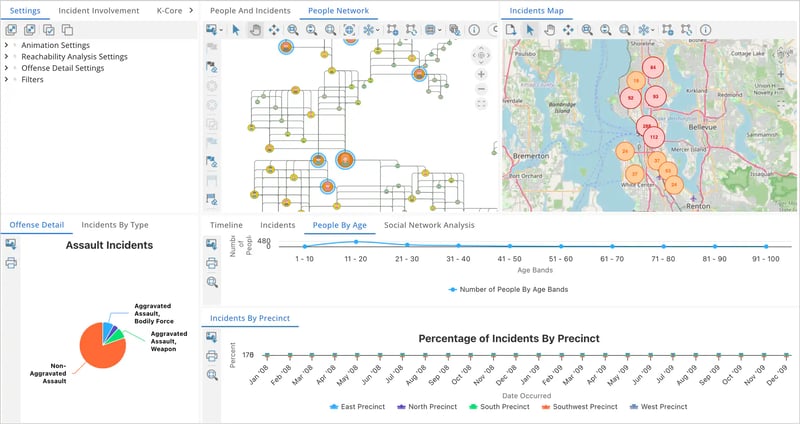
Crime Network

The best companies in the world agree: We're the best!

We work with all types and sizes of companies, from startups to Fortune 1,000 companies, that span many different industries including Finance, IT, Manufacturing, Aerospace, and Automotive. Our flexible graph solutions are used by software developers, database architects, systems engineers, data scientists, and more.

We are proud to work alongside the best and brightest in their respective fields.

 

Tom Sawyer Software works with all types and sizes of companies, from startups to Fortune 1,000 companies, that span many different industries.

Discover our latest releases

Available Now
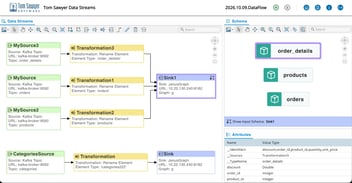
2026.09.13.0.DigitalEngineering

Tom Sawyer Digital Engineering 1.0.0 is the authoritative source of truth across engineering systems:

  • Modern, web-based product suite built on a knowledge graph architecture.

  • Connects planning, process, engineering models, and more, in support of the engineering V-model.

  • Enables traceability and understanding of the impact of changes across the engineering lifecycle.
Available Now

Tom Sawyer Perspectives 13.7.0 map view with precise shape clipping

Tom Sawyer Perspectives 13.7.0 delivers graph visualization and layout enhancements that make working with complex data more flexible and intuitive:

  • Improved swimlane header readability.

  • Improved disconnected node layout.

  • New fixed node size layout setting.

  • Major platform upgrades.

Available Now

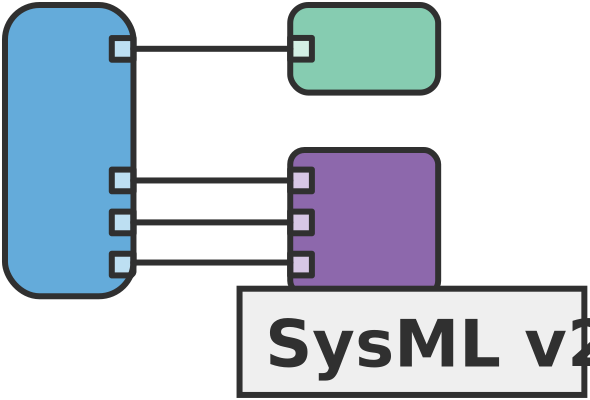
Tom Sawyer SysML v2 Viewer 2.1.1 expands interoperability by adding support for Flexo and validating compatibility with the SysML v2 API and Services implementation in Teamwork Cloud 2026x.

Tom Sawyer SysML v2 Viewer 2.1.1 expands interoperability by adding support for OpenMBEE Flexo and validating compatibility with the SysML v2 API and Services implementation in Teamwork Cloud 2026x.

  • Support added for OpenMBEE Flexo for graph-native model visualization.

  • Verified compatibility with Teamwork Cloud 2026x.

Available Now

Tom Sawyer SysML v2 Viewer 2.1 expands SysML v2 graphical syntax support and improves diagram stability and readability.

Tom Sawyer SysML v2 Viewer 2.1.0 expands SysML v2 graphical syntax support and provides enhanced visualization capabilities:

  • Support added for n-ary relationships.

  • Orthogonality of edges preserved after diagramming interactions.

  • Improved disconnected node placement and edge spacing.

Use cases solved by our solutions

We have applied our graph expertise to 100s of different use cases and technology stacks, helping enterprises tackle their big data challenges. No matter your unique application requirements or data source, there's a good chance we have encountered it.

Our unparalleled graph drawing capabilities set us apart from our competitors who provide simple, spring embedder-type layouts. Our five advanced graph layout algorithms have been perfected over the decades and allow us to handle your most challenging requirements, whether that's for detailed electrical schematics, knowledge graphs, location-based visualizations, deeply nested data, and much more.

We have also developed a suite of graph analysis algorithms allowing you to apply advanced graph analytics to gain additional insight into your data.

And our graph technology platform has been perfected with regular releases over the past 28 years.  

Here are just a few examples of some of the use cases our graph experts and solutions have helped address.
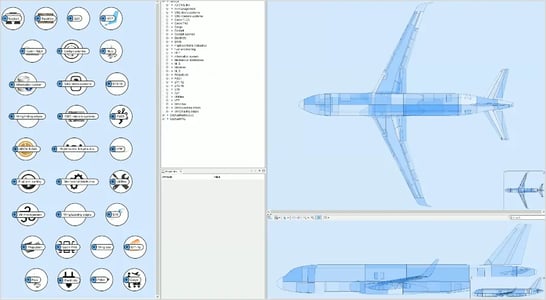
Airplane Physical and Logical Electrical System Diagram

Mechanical and system design

Systems engineers rely on precise schematics when designing complex machinery such as airplanes. Our precision graph drawings excel in this area. We partnered with a top manufacturer to develop a touchscreen application that showed the physical and logical connections of an airplane's electrical system, providing context to technical and non-technical users alike with our powerful visualizations and ability to navigate the electrical system. Learn more.
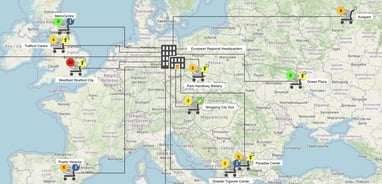
Supply Chain With Chart

Supply chain analysis

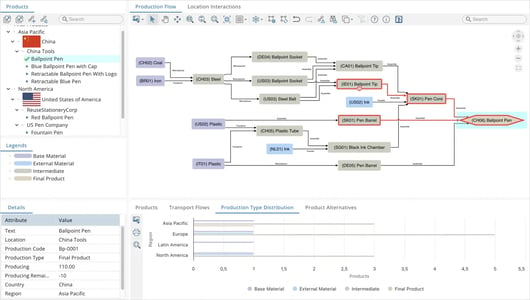
In today's global business environment, supply chains quickly become complex as you source materials from different partners around the world. Add in weather, pandemics, staffing, and other issues, it can be a challenge to maintain inventory and keep up with demand. We built this example application to showcase our capabilities. The application presents a real-world supply chain that you can navigate and identifies problematic chains. Sign up and test drive it for yourself to see the possibilities.
Enterprise Knowledge Graph

Enterprise knowledge graphs

As data becomes larger and more complex, organizations can discover insights in their knowledge graph with Perspectives. The data integration layer can effectively and efficiently load structured graph data into a native graph, in-memory graph model while advanced graph visualization and analysis provide ways to find and understand the pertinent information in the knowledge graph. Learn more.
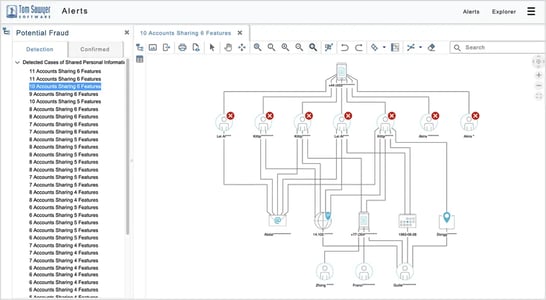
Graph of Fraud Alerts in Financial Transactions

Link analysis

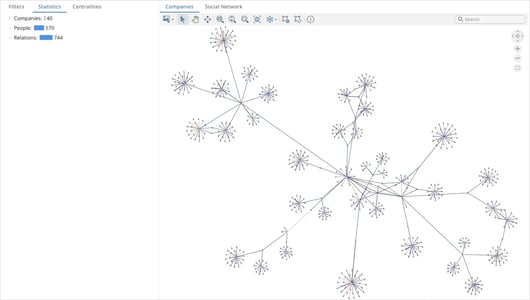
Link analysis applies to financial fraud, policing, military and defense applications, and more. Link analysis is a technique to evaluate relationships between nodes. When combined with other types of analyses, such as betweenness and degree centrality, these graph techniques are powerful tools to identify fraud before it happens. Learn more.
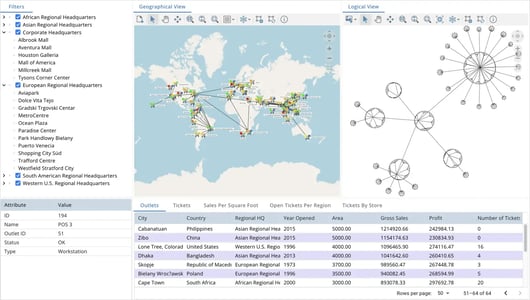
IT and Network Management Dashboard of Graphs and Charts

IT and network management

IT and network managers need fast, reliable ways to manage their networks. Since these networks can be modeled well with graphs, Perspectives visualizations, analysis, and synchronized views can help managers to better understand and optimize networks. Try this hands-on example application and see for yourself.
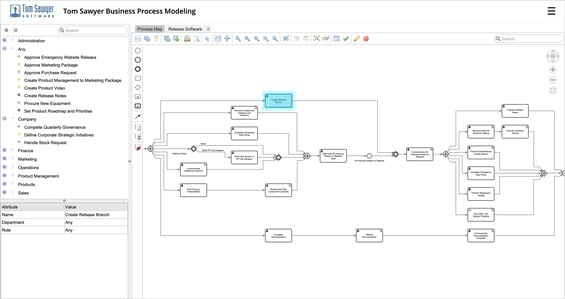
Graph of Multi-Step Business Process

Business process modeling

Process is key to keeping an organization running efficiently. Our advanced graph visualization technology keeps process modelers focused on designing processes instead of rearranging boxes. No matter how complex the process, tasks are automatically laid out in a readable graph that everyone can follow. Learn more.

Start your graph journey today

Contact us to discuss your use case.

We transform your data into actionable visualizations

Our graph technology solutions transform your data into beautiful, accurate, and readable graph and data visualizations. 

In a matter of minutes, federate and integrate data from almost any data source and format, and create a beautiful dashboard of visualizations. 

Drag the slider below to see the before and after.


Watch these videos to learn how easy it is to connect to a data source and create visualizations with Perspectives, our graph platform.

Why work with Tom Sawyer Software?

35-year Track Record

35-year track record

We have a long history of developing cutting-edge graph technology solutions and partnering with enterprises and integrators to build game-changing experiences with data.
Practical Experience

Practical experience

We have practical experience solving problems for almost every size and type of organization, in almost every industry. Our graph experts have seen hundreds of different use cases and apply their combined decades of experience to your unique challenges.
Deep Technical Knowledge

Deep technical knowledge

We have built a reputation as having a keen understanding of and hands-on experience with cutting-edge technologies.
Unrivaled Graph Drawing

Unrivaled graph drawing

No other software produces clean, readable graphs like our graph software does. We offer five graph layout styles, each suited to different use cases.
PreBuilt And Custom Solutions

Pre-built and custom solutions

One size doesn't fit all. When one of our pre-built, off-the-shelf solutions isn't enough, our graph application development platform provides the flexibility you need to create a custom solution.

Exceptional Technical Support

Exceptional technical support

Our team of graph gurus can do it all: solve a technical challenge, provide advice for graph best practices, build a custom graph application for you, or integrate graph technology into your existing solution.

What customers are saying

TIBCO

[Tom Sawyer Software] makes our product easier to demonstrate, and shows the larger picture to customers.

TIBCO

Hursley Hub

We have partnered with Tom Sawyer Software and received excellent service that has complemented its outstanding visualization platform.

Hursley Limited

Procter & Gamble

Tom Sawyer Software always falls in love with the business problem before employing its deep problem solving skills and unparalleled mastery of the data/knowledge visualization and graph analysis domains. The result is innovative yet practical solutions that consistently exceed expectations. 

Procter & Gamble

Resource Innovations

All of the talented team at Tom Sawyer Software have been fantastic to work with, and set a high standard for software development and support.  I highly recommend Tom Sawyer Software's products for your data analysis and visualization needs.

Resource Innovations

Discover our products

Tom Sawyer Digital Engineering connects engineering plans, processes, models, and data across the engineering lifecycle

Tom Sawyer Digital Engineering is a modern, web-based product suite built on a knowledge graph architecture that connects planning, processes, engineering models, supply chain information, and other enterprise data in a shared environment. Unlike large engineering systems assembled from disconnected applications and data silos, Tom Sawyer Digital Engineering is designed around a connected data foundation, using open-source ArcadeDB to support integrated information across the engineering lifecycle.

The suite includes the following optional products, giving organizations a modular foundation they can expand as their digital engineering needs evolve.
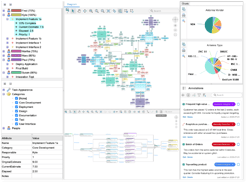
Tom Sawyer Planning

Tom Sawyer Planning

Build strategic plans with graph-based views of teams, releases, and dependencies.


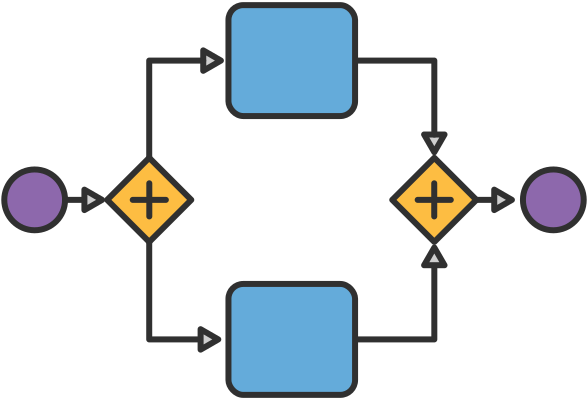
Tom Sawyer Business Process

Tom Sawyer Business Process

Visually model your business processes and then flawlessly and repeatedly execute them.


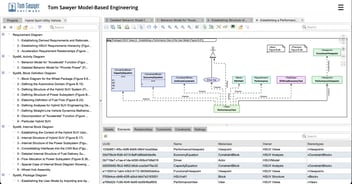
Tom Sawyer Model-Based Engineering

Tom Sawyer Model-Based Engineering

Transform SysML v1 model definitions into customized and highly interactive visualizations.


Tom Sawyer SysML v2 Viewer

Tom Sawyer SysML v2 Viewer

Connect to any SysML v2 API-compliant repository and efficiently explore and understand models.


Tom Sawyer Data Streams

Tom Sawyer Data Streams

ETL structured and unstructured data into a governed knowledge graph for AI and decision intelligence


Tom Sawyer Perspectives

Tom Sawyer Perspectives

A low-code, data-oriented platform for creating custom graph visualization and analysis applications.


Tom Sawyer Explorations

Tom Sawyer Explorations

Interactively query, visualize, and explore graph database data with no coding.


Stand-alone product offerings

We also offer the following products for individual licensing if it suites your use case.

Read these popular blog posts

Digital Twin Applications Powered by Graph-Based System Execution

Digital Twin Applications Powered by Graph-Based System Execution

By Max Chagoya
2026.04.16.0.CADDataIntegration

CAD Data Integration in Digital Engineering Programs

By Caroline Scharf
Digital Twin Creation: From Data to Real-Time System Execution

Digital Twin Creation: From Data to Real-Time System Execution

By Max Chagoya

Get Started

Contact us to talk about your data project and discover how Tom Sawyer Software graph solutions can lead to the answers you need.