Use cases benefiting from data exploration solutions
Explorations addresses critical data exploration needs across various applications, transforming how data is analyzed and utilized.
- Financial Fraud Detection: Identify suspicious activities and hidden connections within vast financial data to prevent fraud and ensure compliance.
- Patient Data Analysis in Healthcare: Analyze patient records and medical histories to uncover data trends and patterns that can lead to better diagnosis and treatment plans.
- Network Security Threat Identification: Detect potential security threats by mapping and analyzing network data to find vulnerabilities and prevent cyber-attacks.
- Social Network Analysis: Understand social structures and influence by visualizing relationships and interactions within social networks.
- Supply Chain Management: Optimize supply chain operations by analyzing data to find inefficiencies, predict demand, and improve logistics.

Tom Sawyer Explorations provides data techniques that can help optimize supply chains.
Industry-specific benefits of data exploration solutions
Explorations brings significant benefits to a wide range of industries by enhancing data visualization and analysis capabilities.
- Finance: Enhance risk management, compliance, and fraud detection with advanced graph analytics.
- Healthcare: Improve patient outcomes through detailed analysis of medical data, uncovering critical insights for better care.
- Cybersecurity: Strengthen defenses by visualizing and analyzing network data to identify and mitigate potential threats.
- Telecommunications: Optimize network performance and customer service by understanding complex communication data.
- Logistics: Streamline operations, predict demand, and enhance supply chain efficiency through comprehensive data analysis.
![]()
Tom Sawyer Explorations brings significant benefits to a wide range of industries.
Powerful exploration tools for exploring data sets

Seamless Data Ingestion
Support for popular graph databases with one-click data mining.

Visual Schema Interaction
Interactive graph visualization to selectively choose which schema elements to visualize.

Interactive Data Views
User-friendly, interactive graph drawing and inspector views that enable data exploration of connected data points.

Customizable Graph Aesthetics
Attribute-based node color and text for customized visualizations.

Advanced Graph Analysis
Built-in graph analysis algorithms for identifying patterns, trends, and anomalies.

Secure and Scalable Deployment
Flexibly deployment options that fit into your existing IT infrastructure.
Connect to these popular graph databases for efficient data exploration
Tom Sawyer Explorations simplifies the data connection process, providing a foundation for exploring data sets and performing in-depth analysis.
Easily connect to your preferred graph database to support your specific data exploration use case. Supported databases include Neo4j, Neptune Gremlin, Neptune openCypher, JanusGraph, OrientDB, and Cosmos DB.


Achieve first data visualization in three simple steps
Connecting to your graph database and getting your first data visualizations is made simple with Explorations. Simply connect to your database and select the schema elements and connections you want to view.
In just two clicks, Explorations automatically generates the query based on the schema elements you choose, displaying it in an easily understandable graph drawing. When you execute the query, Explorations displays the results of the data query in an interactive graph data visualization.

1. Select Data Source
Select the type of graph database containing your data.

2. Enter Connection Details
Enter the database connection details to connect to your graph database.

3. Visualize and Explore Data
Choose the schema model elements you want to visualize, and click Run Query.

Go from schema to data visualization in just a few clicks with Tom Sawyer Explorations.
Visually interact with your schema
There are several variables to consider when it comes to data profiling and exploration. In addition to variables such as the type of database in which your data resides and the data quality and volume, having an understanding of the structure of the schema and cutting through the noise is paramount when performing an exploratory data analysis.
With Explorations' schema viewer, you can focus on the relevant parts of your schema using an interactive graph visualization. The schema viewer provides a high-level view of the schema structure, showing the relationships between schema model element types and the count of each model element type.
In the schema viewer, selectively visualize what matters most by simply selecting the model element types and relationships you care about. Ignoring the data you don't need, will remove unnecessary noise boosting efficiency and insight extraction.

See the structure of your graph database and selectively visualize what matters with Exploration's schema viewer.
Effortlessly construct no-code database queries for data analysis
Quickly uncover insights and effortlessly explore data, without the need to know Gremlin or Cypher query languages.
With the no-code, pattern-matching Query Builder, construct your database search to find graph patterns through an intuitive graph visualization. Easily apply conditions to your queries so you can hone in on the elements of interest.
When you run the query, Explorations automatically returns the results in a visualization of the relationships between elements meeting your search criteria.

The pattern-matching Query Builder leverages an intuitive graph visualization, allowing you to explore and identify graph patterns effortlessly.
Directly enter queries for added flexibility

Analysts have added flexibility to directly enter custom Cypher and Gremlin queries.
For analysts who prefer working directly with query languages, the platform supports manual entry of Cypher and Gremlin queries. This option offers an alternative to the visual Query Builder, allowing analysts to construct and execute queries in their preferred syntax while accessing the same rich graph insights.
Interactively explore relationships to refine your data investigation
With Explorations, you can delete elements from the graph, filter out elements, and automatically load data directly into the graph drawing with the load neighbors feature.
And our automated graph layout quickly cleans up the visualization for overlap-free drawings.

Selectively load elements into the graph drawing to expand your investigation.
Gain data insights with data attributes and criteria selection
With Explorations' user-friendly, interactive graph drawing and inspector views, you can quickly see the data attributes of individual elements.
You can also explore connected data points with intuitive criteria selection, deepening your understanding of complex relationships within your data.

Select elements in the graph drawing to visualize their attributes.
Accelerate your data investigations with synchronized tables
Accelerate your investigation experience with a table view. Add and customize as many tables as needed, selecting element types, attributes, and column order to suit your analysis.
Tables are searchable and synchronized with the drawing view, offering the flexibility and control needed for a seamless and efficient exploration experience.

Table views are searchable and synchronized with the drawing view to enhance the data investigation experience.
Enhance data visualizations with customizable graph aesthetics
Augment your graph drawings to aid in comprehension and provide additional insight to domain experts and stakeholders.
Add attribute-based node color and text to highlight key information, providing data insights that are visually compelling.

Attribute-based node color and text highlights key information, providing data insights that are visually compelling.
Powerful graph analytics at your fingertips
Leverage built-in graph analysis algorithms to uncover data trends, understand network dynamics, and make informed decisions.
Explorations includes a set of social network analysis algorithms that rank based on an importance factor determined by each technique. These algorithms are useful techniques for social network analysis and help reveal important elements in the graph.
Supported algorithms include: Betweenness, Closeness, Degree, Eigenvector, and PageRank.
Learn more about graph analysis here.

Social network analysis ranks elements based on importance to reveal key elements in the graph.
Discover natural clusters in your data
Also included is clustering analysis that finds different types of natural clusters—or groups—in the topology of a graph.
Clustering is a useful technique for operations and enterprise architecture management.
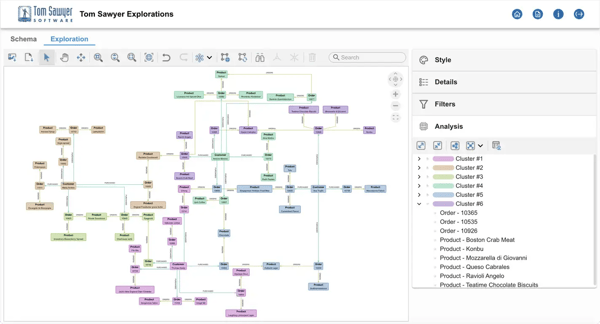
Clustering analysis finds natural groupings in your data providing additional insight.
Create and manage data explorations for a streamlined experience
Ability to manage individual data exploration projects keeps users focused on analysis. Add new projects and Explorations auto-saves database connections, loaded elements, styling, filters, and active analysis algorithms allowing you to effortlessly pick up right where you left off without any worry of losing progress.

Manage your data explorations and effortlessly pick up right where you left off.
Secure and scalable purchasing and deployment options
Explorations can be quickly and securely deployed on-premises or in the cloud, ensuring integration into your tech stack is made easy.
Explorations also provides secure access with integrated authentication options that align with your existing IT infrastructure.

