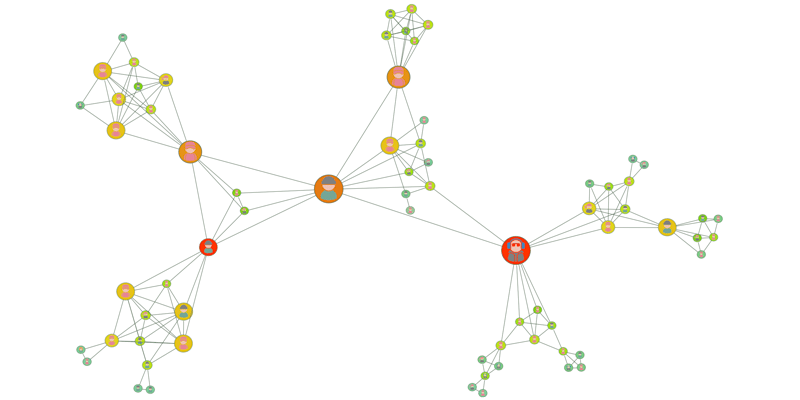
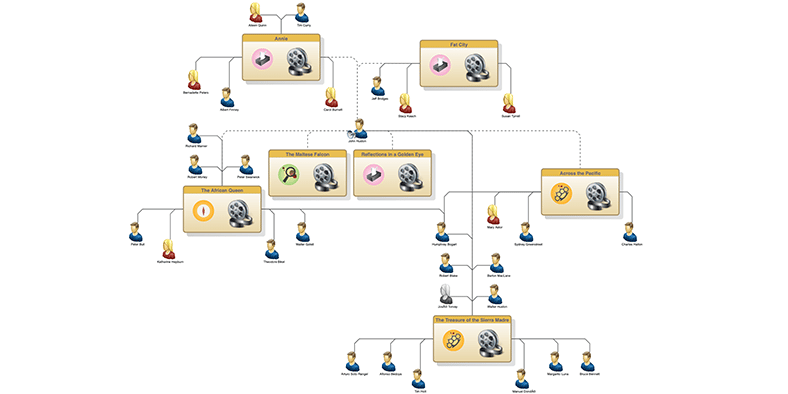
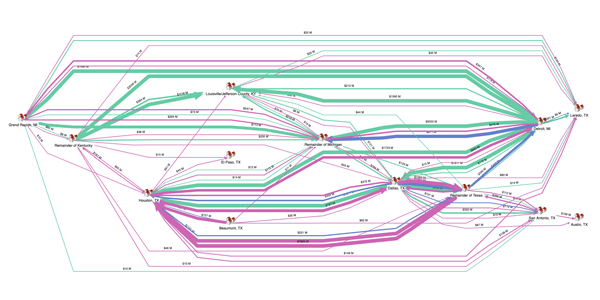
What is graph intelligence?
Graph intelligence refers to the application of analytical and computational techniques to extract insights from graph data structures. It involves analyzing relationships and patterns within networks, where entities are represented as nodes and their connections as edges. This approach is critical in areas like fraud detection, supply chain management, government intelligence analysis, and social network analysis.
A graph intelligence platform helps analysts move beyond isolated records by showing how relationships take shape across large, connected datasets. Instead of treating each entity or event as separate, analysts can examine the wider network structure behind the data and identify patterns that are difficult to detect in traditional relational or tabular views. Tom Sawyer Perspectives supports these workflows for organizations that need to analyze connected data at scale.
Graph intelligence can help you:
- Discover areas of interest in data
- Optimize complex systems or processes
- Deliver key information to stakeholders and decision-makers in a timely manner
- Identify hidden connections across fraud, threat, and supply chain networks
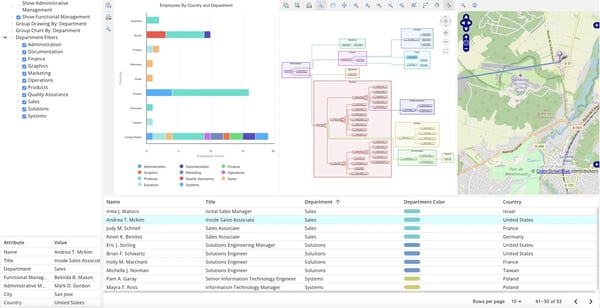
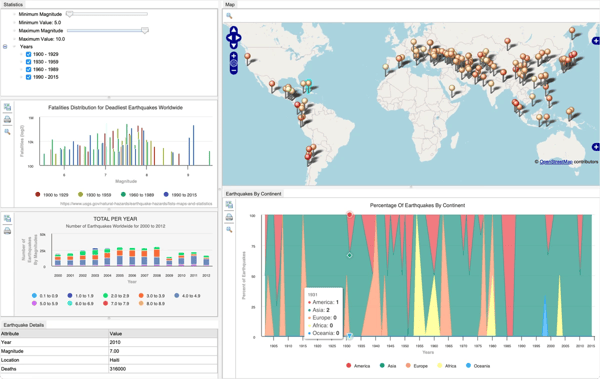
A graph intelligence dashboard for company organizational management.
Why is graph intelligence important?
Graph intelligence enables a deeper understanding of complex relationships and structures in data. In high-stakes environments, the decisive signal is often hidden between disconnected records, operational systems, and the real-world entities they represent. By modeling those relationships directly, graph intelligence helps analysts see how separate pieces of information form a connected picture.
That connected view changes how analysts work. It creates a stronger basis for investigation, surfaces patterns that tabular data obscures, and supports faster, more confident communication with decision-makers.
How graph intelligence improves analytical workflows
Uncover hidden patterns
Graph intelligence reveals intricate connections within large datasets that may remain hidden in tabular or relational views.
Discover key relationships
Graph intelligence highlights important relationships, giving analysts a clearer picture of how entities connect across complex networks.
Enhance decision-making
Graph intelligence delivers insights that support faster investigation, clearer prioritization, and more confident communication with decision-makers.
Predict trends and behaviors
Graph intelligence and network analysis can reveal patterns that support the forecasting of future trends and behaviors.
Optimize networks
Graph intelligence identifies inefficiencies and opportunities across networked systems, from supply chains and communication networks to organizational hierarchies.
Detect anomalies
Graph intelligence surfaces unusual patterns across connected data, supporting fraud detection, cybersecurity, and threat analysis.
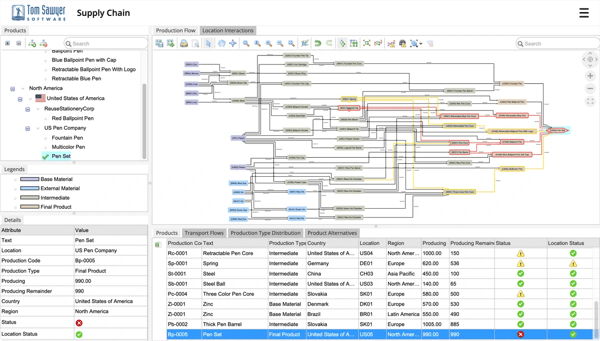
Graph intelligence for supply chain management.
Who can benefit from graph intelligence?
Graph intelligence is applicable across private- and public-sector organizations where understanding relationships between entities is critical. Data analysts, intelligence analysts, data scientists, investigators, security teams, supply chain managers, and systems engineering teams use graph intelligence to investigate connected data and solve complex analytical problems.
Graph intelligence supports use cases across:
-
Manufacturing
-
Law enforcement
-
IT and cybersecurity
-
Banking
-
Insurance
-
Government
-
Digital engineering
-
Supply chain and logistics
-
Fraud detection and prevention

Steps for graph intelligence implementation
For best results when applying graph intelligence to analytical problems, analysts must:
- Have a clear use case
- Identify and gather the various sources of data for analysis
- Use effective graph visualization tools to interpret, navigate, and communicate insights
- Apply the appropriate set of graph intelligence analytics
- Focus on the most relevant data
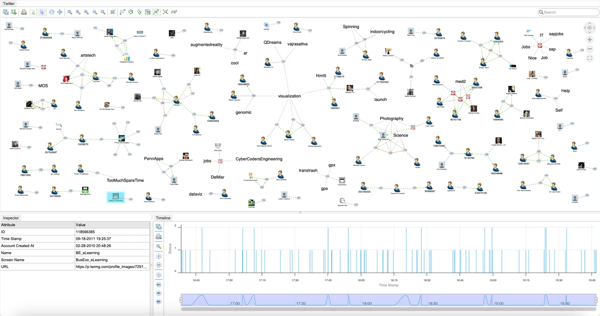
The application of graph intelligence tailored for a specific use case.
Technical challenges of getting started with graph intelligence
Getting started with graph intelligence requires overcoming several practical challenges. Analysts entering the field for the first time often need guidance on which graph techniques apply to their specific use case. For example, analysts focused on direct connections alone may miss more revealing insights from path analysis, a technique that surfaces indirect but significant relationships between entities.
Visualization and analysis tools that fall short of the use case make results harder to interpret and navigate. Equally important is context. Without clear explanations of what graph analytics results mean and why they matter, even accurate findings can be difficult to act on.
Analysts need effective and easy-to-use graph intelligence technology that provides the necessary graph tools. This platform must provide:
- Ability to connect to many types of data sources, including graph databases and relational databases
- High-precision graph visualizations that can be used for complex data
- Efficient graph compute
- Effective data navigation
- Dashboards for communication of results to stakeholders and decision makers
Use graph intelligence to understand important paths in your data.
Navigate to relevant data with the assistance of graph intelligence.
Graph intelligence with Tom Sawyer Perspectives
Tom Sawyer Perspectives is a low-code application development platform for building custom graph intelligence applications. It combines best-in-class graph visualization, an integrated graph analysis library, data integration, and interactive navigation to help organizations create applications that uncover hidden connections, trace relationships, and communicate findings to decision-makers.
For organizations building custom graph intelligence applications, see the Tom Sawyer Perspectives graph platform for developers.
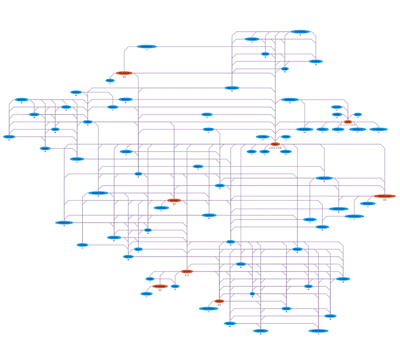
Graph layout
Tom Sawyer Perspectives provides best-in-class graph layout for creating useful, readable visualizations of complex data.
Graph analytics
Tom Sawyer Perspectives provides a graph analytics library with graph intelligence algorithms that can be run in real-time through automated background processes or interactively by users.
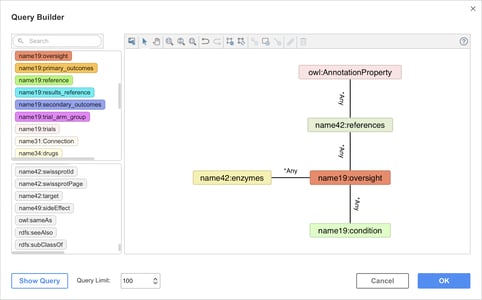
Query builder
Tom Sawyer Perspectives' visual query builder allows you to search for matching patterns in graphs to load data from triple stores and labeled property graphs without the need to know SPARQL, Gremlin, or Cypher query languages.
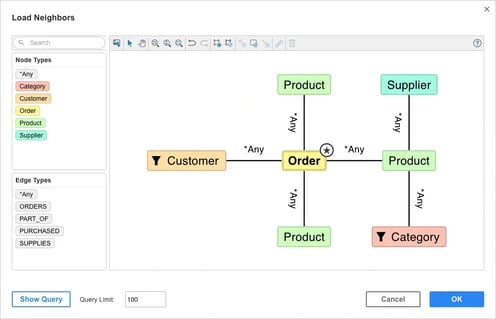
Load neighbors
Tom Sawyer Perspectives' load neighbors feature, with advanced pattern matching, gives analysts control over the data they see and supports efficient navigation during intelligence gathering.
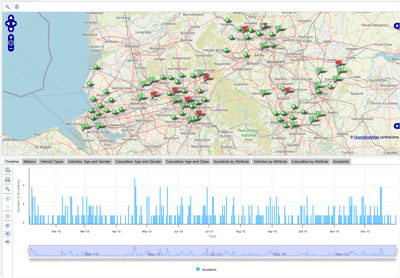
Timeline
Tom Sawyer Perspectives' timeline view helps analysts see when key events occurred, adding context to their analysis.
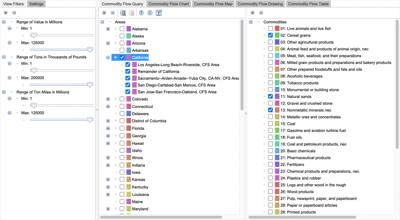
Filters
Tom Sawyer Perspectives' filters let analysts filter out unnecessary information so they can focus on key results.
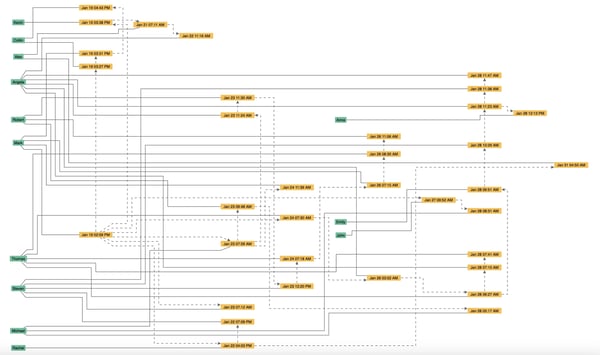
Swimlanes
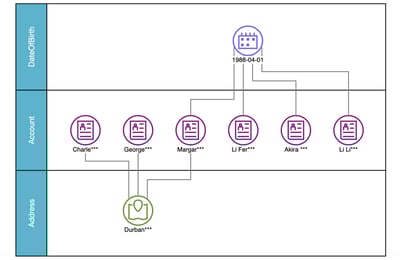
Tom Sawyer Perspectives' swimlanes add at-a-glance categorization of data elements.
View layout
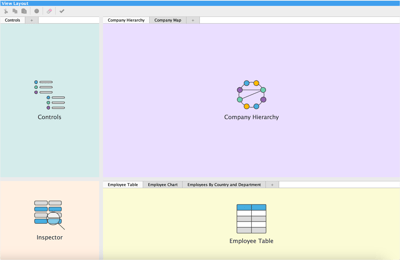
With Tom Sawyer Perspectives, you can create dashboards tailored for your use case and stakeholders in minutes.
Query builder: A tool for structured data retrieval
For successful interaction, analysts must be able to construct complex queries to retrieve specific data from a graph database. Tom Sawyer Perspectives' query builder simplifies accessing targeted information from triple stores and labeled property graphs alike through a user-friendly interface, without requiring analysts to know a technical query language. Users can specify criteria, relationships, and attributes to filter and retrieve data efficiently and effectively, or use advanced pattern matching to create visual patterns and search for connectivity patterns in data. The ability to efficiently create targeted queries enables precise data extraction from complex network structures and facilitates advanced analysis and decision-making.
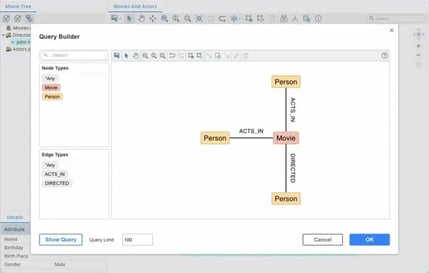
The Pattern Matching Query Builder simplifies accessing targeted information through a user-friendly graph visualization.
Data navigation: The mechanism for exploring network structures
Methodologies and tools that enable intelligence analysts to intuitively traverse and understand complex network structures include techniques such as filtering, searching, and clustering algorithms, which allow users to focus on specific parts of the graph. Graph intelligence platforms such as Tom Sawyer Perspectives employ dynamic layouts and responsive design elements that adapt to user interactions, making exploration of large, intricate networks manageable and insightful. With effective data navigation, analysts can decipher the wealth of information embedded in graph data.
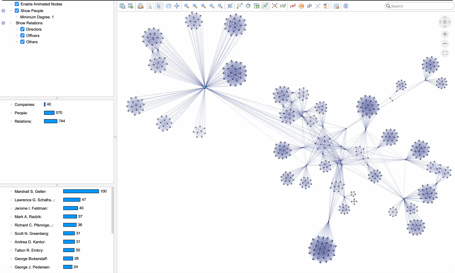
Filtering data allows users to interact with and focus on specific parts of the graph.
Data interaction: User-system interface in graph intelligence systems
User-friendly interfaces support the intuitive exploration of complex graph data. Essential capabilities include zooming, panning, and clicking on nodes and edges to view detailed information, as well as advanced interactions such as expanding, collapsing, hiding, and showing nodes. Effective graph visualization and clear highlighting of analytics results also help analysts focus on the most relevant data and communicate their findings.
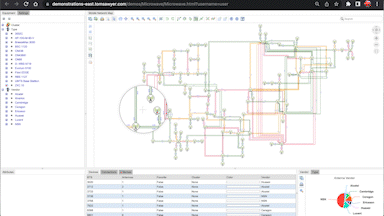
User interaction is an important aspect of graph intelligence.
Gathering your data into a single model
Creating a graph data model tailored to your use case is key to discovering important results. This begins with the definition of a schema to understand the type of data and attributes that will be analyzed.
It is common for data to be contained in any number of different data stores, either graph databases or non-graph data sources, such as SQL, RESTful endpoints, JSON, XML, Excel, and structured text files.
The Tom Sawyer Perspectives graph intelligence platform is data agnostic so that you can build a single schema and apply graph technology to data no matter where it resides. It meets the needs of intelligence analysts by providing a way to import data, perform graph compute, see results, and load related data.
Supported data sources include:
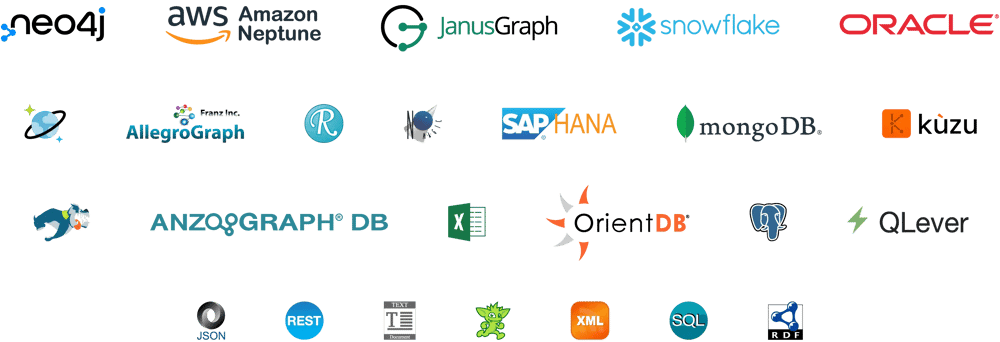
Tom Sawyer Perspectives supports data federation and integration from a wide range of data sources.
Types of graphs used in intelligence
The types of graphs used in intelligence range from simple undirected graphs to complex hierarchical and multilayered structures. Each graph type suits different analytical needs, and selecting the right one directly affects the clarity and precision of the insights analysts can extract
The different graph types are as follows:
- Simple Undirected Graphs: Ideal for modeling symmetric relationships where the direction of connection is irrelevant, like mutual friendships in social networks.
- Directed Graphs: Useful in scenarios where the direction of relationships matters, such as in web link structures or supply chains.
- Weighted Graphs: Employed when relationships have varying strengths or capacities, like in traffic networks or resource flow analysis.
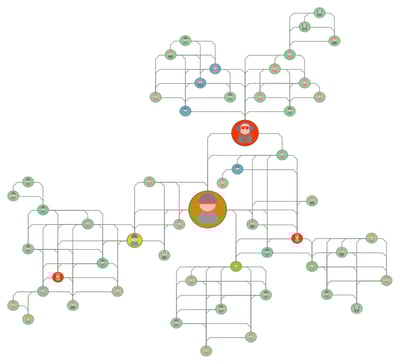
- Hierarchical Graphs: Suited for representing data with inherent hierarchical structures, such as organizational charts or taxonomies.
- Multilayered Graphs: Effective in complex scenarios involving multiple types of relationships or interactions, such as in multifaceted social networks or interconnected systems spanning different domains.
Each type provides a unique lens for examining and interpreting specific aspects of interconnected data.
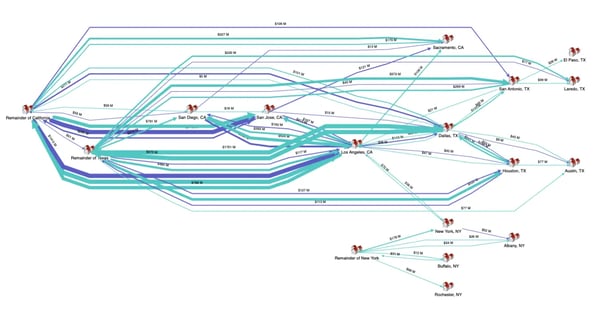
Weighted graph showing relationships of varying strength in the flow of commodities.
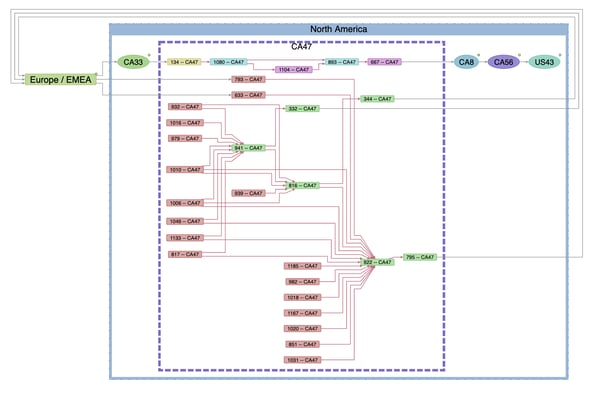
Directed graph of a supply chain.
Applications of graph intelligence
Graph intelligence applications include those used in:
Investigation and Policing
Network Analysis
Systems Engineering
Logistics
Supply Chain
Life sciences
Advertising and Entertainment
Built using Tom Sawyer Perspectives, the following example graph intelligence applications showcase what's possible with Tom Sawyer Perspectives. Sign up and explore.