1992
We began in a small office in Berkeley. Though the nights were long and the menu was mostly takeout burritos, we developed our first graph layout algorithms and Tom Sawyer Software was born.

Early 1990s
We introduced Hierarchical layout, Circular layout, Symmetric layout, and support for nested drawings. Plus, we launched Graph Layout Toolkit, a library of graph layout APIs.

Late 1990s
We released Graph Editor Toolkit, the groundbreaking Orthogonal layout, and the first-ever incremental layout. We also received a NIST Advanced Technology Program Award for "Component-Based Software Technology Development."

Early 2000s
We received a patent award for Labeling Graphical Features of Drawings, released the Graph Analysis Toolkit, and unified our graph rendering products as Tom Sawyer Visualization.
Late 2000s
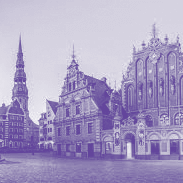
We opened a development center in Riga, Latvia and introduced Tom Sawyer Perspectives, a low-code graph and data visualization development platform.

Early 2010s
We opened a development center in Mexico City. Perspectives advanced with support for composite node UIs and new map, timeline, and chart views. We also received Red Herring's Top 100 Global Award.

Late 2010s
We released end-user applications: Model-Based Engineering, Business Process, and Graph Database Browser. We made our AWS Marketplace debut with Graph Database Browser.

2019
We're passionate about the environment and avid recyclers so we were thrilled to go solar at our Berkeley office.

2020
We opened up a third development center in Heraklion, Greece. Graph Database Browser was made available in AWS GovCloud (US) and we introduced Bundle layout and two-dimensional swimlanes.
