Solve Big Data Challenges with Tom Sawyer Perspectives Graph Drawings
Join us August 16, 2023 at 11a.m. PDT for this live webinar
Gain control of your large and complex data
Join us for an exciting live webinar where we will showcase the incredible power of Tom Sawyer Perspectives graph drawings in solving big data challenges. Gain valuable insights into how graph drawings can revolutionize your data analysis and decision-making processes!

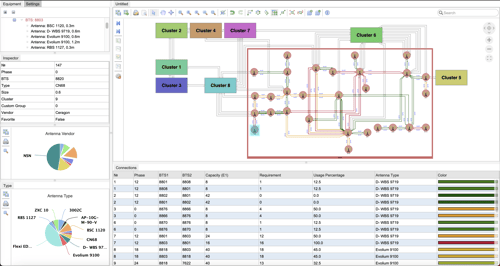
An example telecommunications network application built with Perspectives.
Key benefits
Efficiently overcome big data challenges:
Discover how graph drawings can help you navigate through the complexities of big data. By visually representing complex relationships and patterns within your data, you can uncover hidden insights and make informed decisions with ease.
Unleash the power of graph drawings:
Learn how graph drawings offer a unique and intuitive approach to understanding and analyzing complex data. Our webinar will demonstrate various techniques and best practices to effectively leverage graph drawings for maximum impact.
Enhance collaboration and communication:
Explore the collaborative nature of graph drawings and see how it enables teams to work together seamlessly. With the ability to share visual representations of your data, you can foster better communication and drive alignment across your organization.
What to expect
During this live webinar, we will:
- Discuss the concept of graph drawings and their relevance in solving big data challenges.
- Show a live demo of Tom Sawyer Perspectives graph drawings in action.
- Share practical tips and best practices for effectively utilizing graph drawings for data analysis.
Who should attend
This webinar is designed for:
- Data engineers and analysts seeking innovative ways to visualize and analyze complex data.
- Decision-makers looking for strategies to unlock the full potential of their data through graph drawings.
- Individuals that are interested in learning about the latest advancements in big data analytics and visualization.
About the host

Janet M. Six, Ph.D.
Senior Product Manager
Tom Sawyer Software
Janet Six is a data scientist who helps companies to more effectively use big data and improve user experience within their products while considering their financial, time, and technical constraints.
For her research in information visualization, Janet was awarded The University of Texas at Dallas Jonsson School of Engineering Computer Science Dissertation of the Year Award. She was also awarded the prestigious IEEE Dallas Section Outstanding Young Engineer Award.
Her work has appeared in the Journal of Graph Algorithms and Applications and the Kluwer International Series in Engineering and Computer Science. The proceedings of conferences on Graph Drawing, Information Visualization, and Algorithm Engineering and Experiments have also included the results of her research.
She is also a dynamic public speaker and has been invited by several groups in the Dallas area. Janet was the Managing Editor and columnist for UXmatters, the premier online magazine in the user experience field.
TECHNOLOGIES
Copyright © 2024 Tom Sawyer Software. All rights reserved. | Terms of Use | Privacy Policy
Copyright © 2024 Tom Sawyer Software.
All rights reserved. | Terms of Use | Privacy Policy